JOIN THE WEBINAR | Summer 2026 in Foodservice: Results in Spain and International Trends.

At Delectatech, we analyze the results of Spain’s Food Service sector every year to understand how the industry is evolving and what trends are emerging in out-of-home consumption.
In Delectatech’s annual webinar, we share our analysis of 2025 HORECA (Hotels, Restaurants and Coffee shops) data and compare it with the 2024 figures. We also discuss these findings with key figures from the restaurant and food service sectors to provide further context for the results.
In this article, you will find:
All data comes from a comprehensive market analysis conducted using Delectatech’s AI technology, covering more than 250,000 establishments nationwide. In other words, this is a structured overview of the entire market.
If you work in the Food Service sector, this report will help you understand where the market is headed and how to prepare for 2026.
The analysis is based on Delectatech’s artificial intelligence and machine learning engine. This technology continuously builds and updates a digital census of Spain’s Food Service sector, providing a comprehensive view of the market.
We’re talking about millions of data points processed to identify:
The result is a system that structures the market into HoReCa market units, allowing for a detailed analysis of the behavior of the entire food service sector.
Delectatech’s AI tracks and categorizes publicly available digital market data. It then classifies and standardizes the information gathered from each establishment.
This enables the creation of a constantly updated map of the food service industry and ensures traceability within the hospitality sector, allowing users to track the industry’s evolution.
By 2025, the global economy had experienced a controlled slowdown, with less inflationary pressure than in previous years, though inflation remained under close watch. The focus, rather than curbing rising prices, had shifted to determining whether economies could sustain growth without harming consumption or employment.
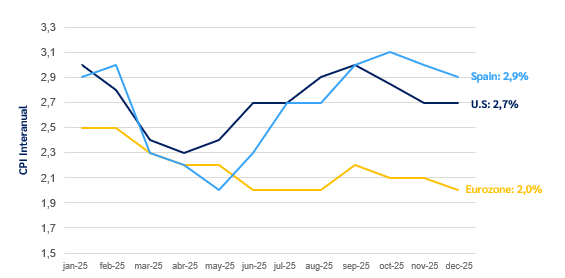
Figure 1 – Year-over-year CPI trends in the U.S., the Eurozone, and Spain. Source: INE (National Institute of Statistics), FED (Federal Reserve), and ECB (European Central Bank)
In the United States, GDP has grown by around 2.5%, demonstrating resilience. However, inflation, particularly in the services sector, has been more persistent than expected.
In the Eurozone, growth has been more moderate, ranging between 1.0% and 1.3% of GDP. Inflation has been aligning with the European Central Bank’s targets, although the services component continues to show resilience.
Spain has stood out among its European partners. GDP has grown by around +2.8%, above the Eurozone average, driven mainly by domestic demand. Forecasts for 2026 project growth of between 2.0% and 2.2%, according to the Bank of Spain and the OECD.
At the same time, inflation in Spain has stabilized at around 2.9% year-over-year although the services sector continues to face greater pressure. The labor market has continued to improve, with an unemployment rate of around 10.4%, which supports household consumption.
But the outlook is not without risk. Geopolitical and trade tensions, high public debt, and a possible slowdown in tourism after several record-breaking years are factors to monitor. Rather than an immediate recession, the perceived risk is a potential global financial crisis linked to inflation, debt, and exchange rates.
Spanish households are entering 2026 in a fairly stable financial position. The labor market has improved, incomes have risen, and, following the pandemic, the population has returned to a state of financial health. This creates a solid foundation for consumption, although it remains influenced by day-to-day price trends. In 2025, gross disposable income increased by +4.2%, meaning more resources for both spending and saving. In theory, this growth should boost consumption in sectors such as restaurants. However, part of that improvement is offset by inflation and structural expenses that continue to put pressure on the household budget.
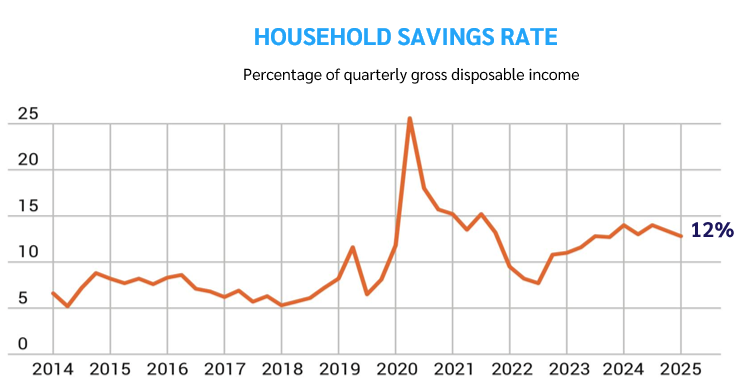
Figure 2 – Household savings rate in Spain. Source: INE (National Institute of Statistics), FED (Federal Reserve), and ECB (European Central Bank)
At the same time, the savings rate remains around 12% of disposable income. This is a high level and reflects prudence. However, signs of a slowdown have been observed in 2025, suggesting that part of the accumulated savings is gradually being redirected toward consumption.
Another relevant figure is the level of indebtedness. Spanish households have a debt level approximately 15 points below the European Union average. This low leverage provides room to absorb potential economic shocks and helps sustain spending in an environment of uncertainty.
So why isn’t consumption accelerating more strongly? Because, although financial capacity exists, consumers continue to act cautiously. Inflationary pressures, particularly on basic goods and services, are influencing decisions. Consumption remains steady, but with greater spending control, a focus on value, and more selectivity.
This balance between economic capacity and prudence is one of the keys to understanding how consumption has evolved in 2025.
We will now move on to the analysis of the Spanish Food Service sector. At Delectatech, we track market trends using three key indicators: occupancy, average check, and satisfaction.
Occupancy measures the percentage of capacity utilized at each location. If an establishment has a 60% occupancy rate, it means it is utilizing 60% of its total capacity. At Delectatech, we don’t just look at a single snapshot. We analyze occupancy by the hour, by day of the week, and by establishment, and then aggregate the data to gain a comprehensive view of the food service industry.
In 2025, average occupancy showed a year-over-year change of -0.3% compared to 2024. That’s a drop of three-tenths of a percentage point. In practical terms, occupancy is essentially flat.
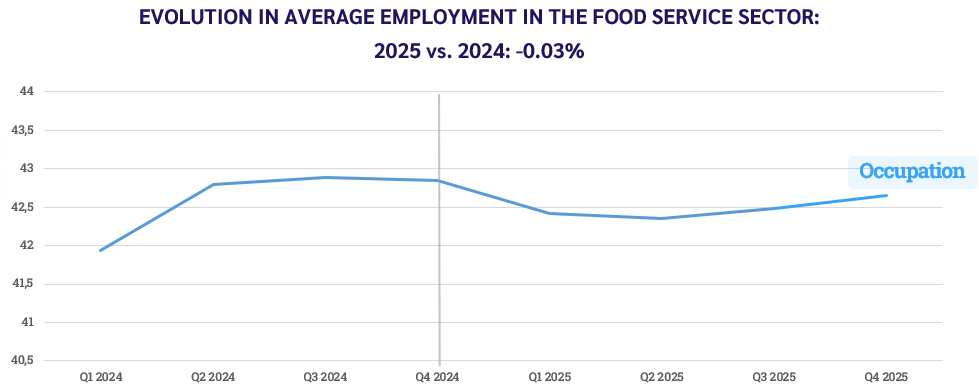
Figure 3 – Employment trends between 2024 and 2025
Were the venues less crowded?
The short answer is no. The -0.3% change indicates stabilization. Consumers have maintained their frequency of dining out, a trend very similar to that of the previous year.
In other words, volume remains stable within the food service channel, although with slight variations between quarters and regions. In 2025, people continue to go out just as they did in 2024. We can say that the foood service sector is not losing momentum in terms of visits, but it is not accelerating either.
The second indicator is the average check, that is, the average amount spent per diner per visit. Here, we analyze how much each person spends on a meal. To estimate this, the model integrates data from directories, photos of receipts, reviews, and various digital signals processed by the AI engine.
In 2025, the average check will grow by +2.5% compared to 2024. This is a higher increase than the one recorded the previous year, which was +1.9%. At first glance, this appears to be a positive trend.
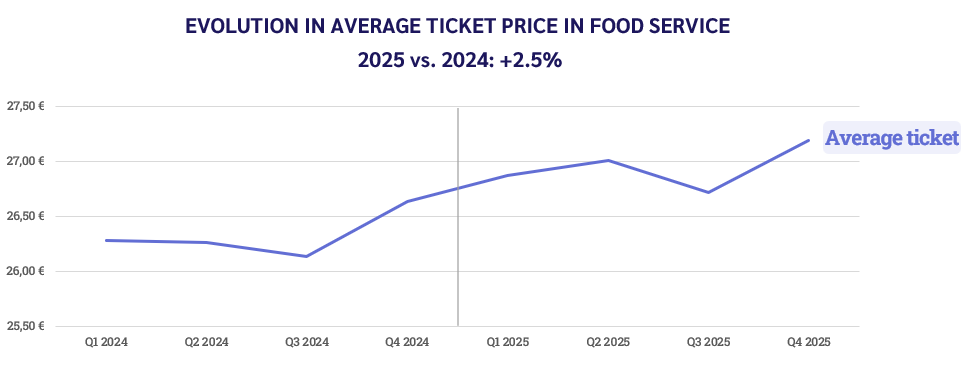
Figure 4 – Evolution in average ticket price between 2024 and 2025
However, there is an important caveat. Inflation in the food service sector has stood at +4.6% year-over-year. This means that the average check is growing two percentage points below sector inflation.
Are we paying more for the same thing?
In nominal terms, yes. Average spending per diner has increased by +2.5%. But that increase does not keep pace with the sector’s rising costs, which stand at +4.6%. This suggests that part of the rise in the average bill is due to general price increases rather than higher discretionary spending by customers.
The gap between the +2.5% increase in the average check and the +4.6% inflation rate indicates spending restraint. Consumers are still going out, but they are adjusting what they consume or how much they spend per visit. For the food service sector, this implies greater pressure on margins and more demanding management of pricing and value propositions.
The third indicator we analyze is satisfaction. Here, the AI engine processes each comment, identifies specific terms, and analyzes their context. Reading “the beer was cold” is not the same as reading “the paella was cold.” The model interprets this nuance and constructs an aggregate index for the entire food service sector.
Customer satisfaction levels in the food service industry fell by -1.1% in 2025 compared to the previous year. This trend reflects a downward trajectory throughout the year, with a slight rebound in recent months. In this context, the decline in satisfaction appears to be linked to rising prices, suggesting that a portion of consumers has reached the maximum price threshold they are willing to pay.
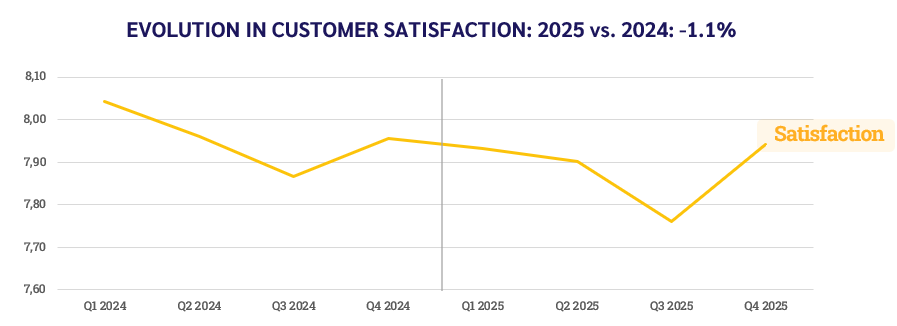
Figure 5 – Evolution in customer satisfaction between 2024 and 2025
The explanation is closely tied to spending patterns. With the average check rising by +2.5% and sector-wide inflation at +4.6%, consumers are comparing prices more closely. They’re paying more attention to “value for money”—that is, they’re evaluating how much they’re paying versus what they’re getting in return.
In the food service industry, this requires refining the menu, service, and perception of quality. Consumers are still dining out, but they demand consistency between price and experience.
One of the indicators that generates the most interest each year is the closure rate. At Delectatech, we don’t just analyze the size of the total number of establishments or the difference between openings and closures. We measure the absolute net closure rate —that is, how many establishments close relative to the total number, without accounting for new openings. This allows us to assess whether the food service sector is gaining or losing resilience.
Since 2022, the closure rate has been declining steadily. In 2025, the trend continues, with a 0.08% decrease compared to 2024.
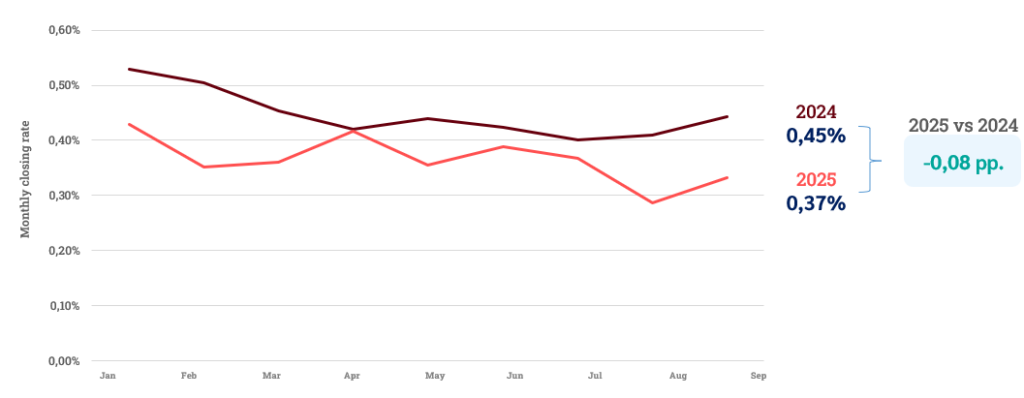
Figure 6 – Trend in the monthly closure rate in the Food Service sector from January to September 2024 and 2025
Looking at the results in terms of volume, there were 37.5 closures per day in 2024. In 2025, that figure dropped to 31.1 closures per day. On an annual basis, the number fell from 13,687 closures in 2024 to 11,183 in 2025.
This represents more than 2,500 fewer closures than the previous year. This indicates that the Spanish hospitality sector is demonstrating greater resilience in the face of pressures such as inflation or changes in consumer habits.
However, breaking down the data by type of establishment reveals some significant differences. In 2024, bars and restaurants had virtually the same closure rates. In 2025, the closure rate for bars stood at approximately 0.33%, while that for restaurants reached 0.41%.
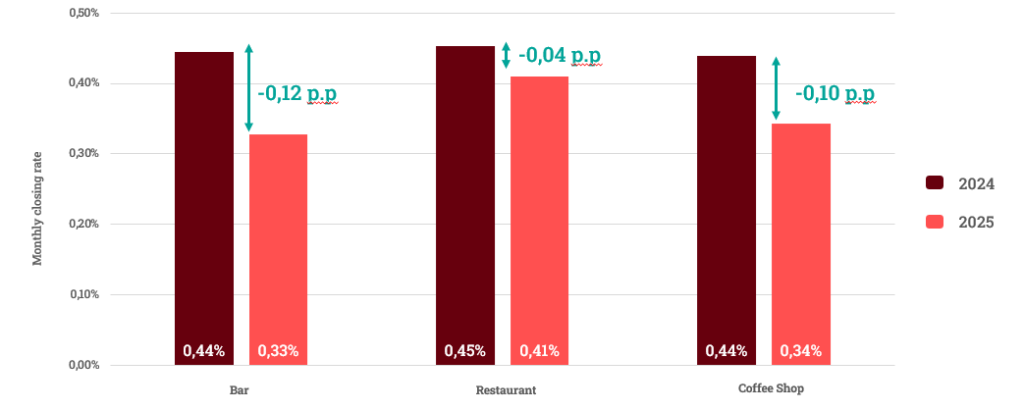
Figure 7 – Trends in the closure rate in the Food Service sector by type of establishment
This is the first time since before the pandemic that bars have had a lower closure rate than restaurants. What does this mean? It means that bars, which are traditionally more vulnerable to economic uncertainties, have managed to adapt better to the current environment. Part of this resilience can be explained by the fact that many bars operate with lower average check sizes and have greater flexibility to adjust prices.
In contrast, traditional restaurants, with more structured menus and higher average check sizes, are under greater pressure. Cafés, meanwhile, remain one of the most stable models in recent years, consolidating a trend of lower vulnerability in the post-COVID period.
Overall, closure data show a more resilient food service sector than in 2024, though with clear differences between business models. To understand where the Spanish food service industry is headed, it is not enough to look at the total volume. We must analyze which formats best adapt to the new balance between spending, price, and consumer expectations.
If you’d like to see a comparison of these indicators by autonomous community, you can download our free report, “FOOD SERVICE RESULTS 2025” which provides a much more detailed analysis of the Food Service sector’s performance in 2025.
Beyond occupancy rates and average check size, an analysis of the Spanish Food Service sector provides insight into what’s happening on menus. In other words, it reveals which dishes and beverages are gaining prominence and which are losing ground in the hospitality industry.
Here, we don’t just measure menu presence. The model analyzes appearances on menus as well as in reviews. If a dish becomes more widely available and also appears more frequently in reviews, it means there is demand. This intersection of supply and conversation is what allows us to detect trends within the food service sector with greater precision.
The dynamics of 2025 clearly explain the balance we’ve seen in occupancy and average check. When consumers adjust their spending, what they consume changes as well.
In 2025, sushi was one of the fastest-growing categories, with a 16.2% increase in popularity. Rather than in premium restaurants, sushi is growing in buffet-style formats, where customers pay between 15 and 25 euros and know they won’t exceed that price range. This model aligns with the observed consumer behavior of cost control and predictability.
The growth of sushi in buffets reflects an interesting combination: on the one hand, perceived value, and on the other, a social experience without the risk of overspending. This format appeals to consumers who want to go out but have a set budget. At the same time, pizzerias and fast-food and fast-dining establishments continue to grow in prominence, with increases of 6.2% and 2.3%, respectively. These are agile formats, with lower average check sizes and fast service times. In the current socioeconomic environment, these models are better suited to balancing price and customer expectations.
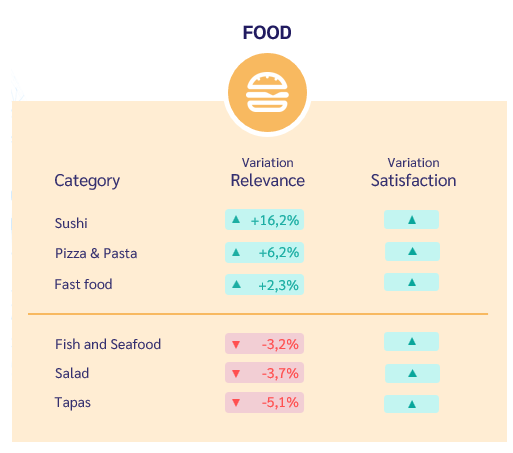
Figure 8 – Ranking of food categories with the greatest variation in online relevance in 2025 compared to 2024. On the right, an indicator of the increase or decrease in customer satisfaction.
In contrast, more traditional “casual dining” such as elaborate tapas or mid-range offerings, has seen a decline since the summer. This segment suffers the most when consumers compare options. It is not as affordable as fast food nor as distinctive as a premium experience.
It is also important to consider indirect competition. Supermarkets have expanded their offerings of prepared meals and daily takeout specials. This overlap between the restaurant industry and food retail particularly affects traditional dining focused on functional consumption.
In summary, by 2025, growth will be concentrated in value-driven and experiential formats. The Food Service industry may be driven by trends, but it is also shaped by adaptation to the economic context.
In the beverage sector, the trend is more structural. Coffee continues to lead in terms of relevance, with a 10.1% increase. It is a stable category within the foodservice sector, linked to both daily routines and social occasions.
Alongside coffee, the healthier segment continues to grow. Smoothies and juices are more prominent in product offerings and consumer conversations, with a 4.7% increase. Consumers are seeking options perceived as lighter or more functional, especially in the morning and afternoon.
In spirits, the non-alcoholic segment is gaining ground slightly, with a +0.3% increase. There is a greater presence of “zero” options and cocktail offerings adapted to this trend. This appeals to consumers who want to socialize without necessarily consuming alcohol.
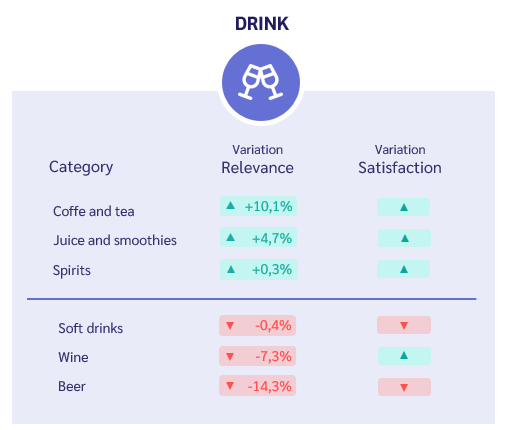
Figure 9 – Ranking of beverage categories with the greatest change in online relevance from 2024 to 2025. On the right, an indicator of the increase or decrease in customer satisfaction.
And what about beer and wine?
Both continue to lose ground. Even when comparing 2025 to 2024, the downward trend persists. For beer, the decline has been ongoing for a couple of years and continues in 2025 with a drop of -14.3%. For wine, the decline is more gradual, but it still registers a drop of -7.3%.
In the Food Service sector, this forces a reevaluation of its beverage offerings and margins, an area traditionally critical to profitability.
Overall, beverage trends in 2025 point to a more fragmented market. Consumption is diversifying, becoming more conscious, and adapting to new priorities.
The Coffee & Bakery segment continues to grow steadily. This trend didn’t begin in 2025. It dates back to the Covid era, but this year it has solidified its position. The afternoon slot has gained prominence. Brunch and, above all, “tardeo” really took off in 2025. In cities like Barcelona, this trend was already evident in 2024, but it was in 2025 that the “tardeo” concept clearly spread throughout Spain.
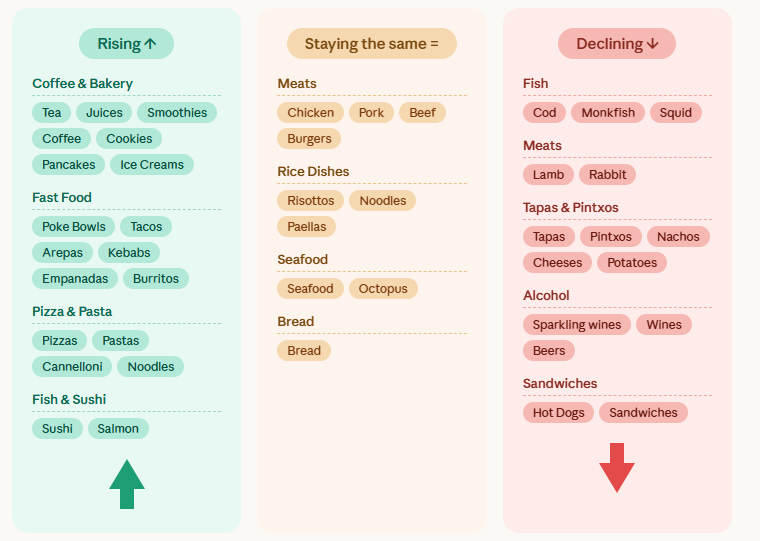
Figure 10 – Ranking of trends in culinary offerings. Products with the greatest increase and decrease in
online relevance between 2025 and 2024.
This growth stems from the fact that consumers are seeking social experiences, but ones that are shorter, more budget-friendly, and paired with smaller portions of food. This trend favors coffee shops and hybrid formats.
For the same reasons, the other categories seeing the biggest growth, as we’ve already seen, are Fast Food and Pizza & Pasta.
At the same time, more traditional products continue to lose ground, and sales of alcoholic beverages continue to decline compared to the previous year.
If there is one product that defines 2025 in the food service industry, it is the pistachio. It has been, without a doubt, the star of the year. It appears in desserts, pastries, ice cream, and even beverages—including coffee and mixed drinks. Its presence is widespread and consistent across the analysis.
Alongside pistachios, the healthy food trend continues to gain momentum. Matcha and iced lattes have established themselves as staples. This is a sign that consumers are seeking alternatives perceived as lighter or more functional within the food service industry.
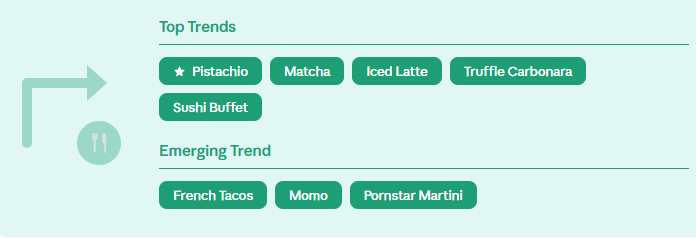
Figure 11 – Top Emerging Food Trends for 2025
In terms of dining formats, the sushi buffet remains a major trend. We’ve already seen how well this model fits into a climate of cost-cutting.
In Italian cuisine, truffle carbonara has taken center stage in pasta and pizza dishes. In fact, the pasta and pizza segment was one of the best-performing categories in 2025.
There are also new signs worth watching as we look toward 2026. The momo, a dumpling of Nepalese origin, is beginning to gain visibility in the market. And in the cocktail scene, the Pornstar Martini stands out—a cocktail created in 2002 in London that has experienced a notable resurgence this year.
Are these established trends or one-off spikes?
At this point, they are still in the growth phase. But their acceleration in 2025 within the food service sector makes it worth keeping a close eye on them throughout 2026.
For a more in-depth analysis of culinary trends, you can download our report “FOOD SERVICE INDUSTRY OUTLOOK 2025” for free.
If we distill all the data into a single question—namely, what type of establishment has performed best in the Spanish Food Service sector in 2025?—the conclusions are quite clear.
In 2025, restaurants located in northern Spain have shown better relative performance. This is not just a one-off occurrence in a specific quarter; it is a sustained trend.
These establishments have been better able to manage margins and adjust prices without significantly compromising their performance. When a business has the flexibility to slightly lower its average check or absorb part of the cost increase, it can better maintain its competitiveness within the restaurant industry.
If there’s one format that stands out again in 2025, it’s the coffee shop. It has been growing for years, but this year it is solidifying its position as one of the strongest models in the hospitality sector.
Why do they perform so well?
First, because they have higher profit margins per customer. Second, because they can easily introduce new products. And third, because they extend consumption times to practically the entire day.
The afternoon slot, brunch, and mid-day consumption continue to grow. This allows coffee shops to generate revenue during more hours of the day, something other formats don’t always achieve.
Furthermore, within the current market, they are among the few models that have managed to increase the average check with relative ease, relying on turnover, complementary products, and new offerings.
In terms of food offerings, the trend is also clear. Fast food, fast dining, and coffee & bakery concepts are expected to perform best by 2025.
These models are well-suited to a market where consumers are more price-sensitive and seek clear, accessible options that offer immediate perceived value.
The winning business model is one that can adapt. Establishments with lower average check sizes have greater flexibility. They can raise or lower prices slightly without drastically altering customer perception. That flexibility is a clear advantage in the Food Service sector in 2025.
In contrast, more traditional establishments with higher average check sizes have had a harder time absorbing cost pressures and changes in consumer behavior.
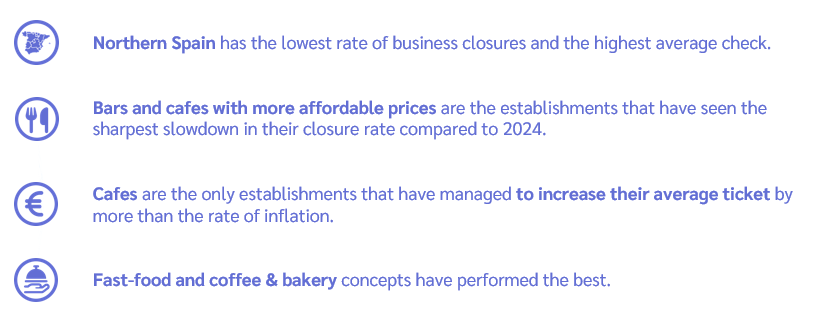
Figure 12 – Profile of the highest-performing establishment in Spain in 2025
To access the full report on the 2025 Restoration results, you can download it for free at the following link: “2025 FOOD SERVICE RESULTS”.
After a detailed analysis of the indicators for the Spanish Food Service sector, the webinar moved on to a panel discussion. The focus was on providing a strategic overview of the market from various perspectives within the Food Service sector and the food ecosystem.
The roundtable brought together complementary experts who offered different perspectives on the foodservice sector.
Edurne Uranga, VP of Foodservice Europe at Circana, provided a macro view of out-of-home consumption, sharing aggregated data on visits, spending, and behavior by occasion within the foodservice sector.
Pablo de la Rica, Retail & Foodservice Manager at AECOC, focused his remarks on structural shifts in consumer behavior and the increasingly evident overlap between the Food Service sector and food retail.
This combination allowed for a broader analysis that went beyond indicators such as occupancy rates, average check size, or closures.
Edurne made it clear that the market appears stable, but there is a lot of activity beneath the surface. She shared a key statistic that helps explain the evolution of the Food Service sector. Currently, consumption is split roughly 60% on-premises and 40% off-premises, including takeout and delivery.
That 40% is not a temporary trend. It reflects a well-established shift in consumer habits. Off-premises consumption already accounts for nearly half the market.
Now, when we look at the trend for 2025, the year ended generally stable. However, the second half of the year saw a 0.2% decline in visits. It is not a sharp drop, but it is a sign of a gradual slowdown.
As for delivery, the market in Spain exceeds 2.000 millions euros annually. This is a significant figure within the hospitality sector, although it also shows signs of a slowdown in growth.
That said, the most interesting part of the presentation was the generational analysis.
The younger generations, especially Generation Z and Generation Alpha, have different patterns. They consume food frequently, but not necessarily at traditional restaurants. Much of their consumption occurs in alternative formats, such as retail hot food counters, convenience stores, vending machines, or ready-to-eat meals.
In other words, part of the consumption that was previously automatically attributed to the Food Service sector now competes directly with food retail.
Retail has professionalized its prepared food offerings. It is an increasingly sophisticated proposition that competes with daily specials, traditional fast food, and even some casual dining occasions.
In this scenario, competition is no longer just between different types of establishments within the food service sector. It is between channels. Food Service and retail are vying for the same consumption occasion.
The baby boomer generation follows a different pattern. They seek more of an experience, more time in the dining room, and a greater social component. In contrast, young people prioritize speed, clear pricing, and convenience.
Looking ahead to 2026, the message was cautious. If clear incentives are not created, the market could enter a slight contraction. Not due to structural weakness, but due to a loss of momentum after several years of strong recovery.
Pablo was very straightforward from the start. We are entering a new era of food consumption due to a structural shift in how we live.
1 in 3 households in Spain consists of a single person. Furthermore, 62% of households have fewer than three people. This represents a profound change in the fundamentals of consumption.
When households are smaller, the dynamics change. There is less planning, less bulk cooking, and less stock in the fridge. Pablo also added that not only are fewer people living in each household, but homes are now smaller. Smaller kitchens, less storage space, and fewer utensils.
What does this mean for the hospitality sector?
It means that cooking is no longer a mandatory daily routine but has become a more occasional activity. The president of Spain’s leading retail chain himself predicted seven or eight years ago that cooking would become more concentrated on weekends and specific occasions. And that prediction has driven a strong strategic focus on prepared meals.
Retail has strengthened its “ready-to-eat” offering. In the case of the market leader, we’re talking about more than 1,600 stores, with this model already implemented in about 1,400 of them.
Moreover, this isn’t entirely new. Pablo recalled that as early as the 1980s, hypermarkets were selling roast chicken on weekends. The difference lies in the current scale and level of professionalization.
Today, even in markets like the United States, we see that 10% of new construction in some major cities does not include a kitchen.
Today’s consumer doesn’t distinguish between channels. They don’t think in terms of the “food service sector” or “food retail”. They think about meeting a need. And that need can be immediate.
Pablo explained this with a very clear distinction: “eating out of necessity” and “eating for pleasure.” From Monday to Thursday, a significant portion of consumption is driven by necessity. That is, grabbing a quick meal to get through the day. Here, the retail sector is doing a great job of developing this offering.
In the United Kingdom, for example, prepared meals are already one of the main drivers of in-store traffic. The portfolio is organized into three categories: food to eat (for immediate consumption), food to later (for later consumption), and food to keep (for storage). This approach is also beginning to emerge in Spain.
In this scenario, food retail is no longer just a supplier of ingredients but is now competing directly with certain segments of the foodservice industry.
Is this a threat to the food service industry?
It actually looks more like an opportunity.
The market is going to grow because consumers will cook less at certain times. Retail needs expertise in the food service industry. Their margins are very tight, and this isn’t their traditional business. That’s why there’s an opening for partnerships.
And we’re already seeing examples in Spain. Restaurant brands producing for food retail, dedicated production facilities, and agreements with distribution chains. This lends credibility to the shelf and allows retail to explore higher-value-added segments.
Additionally, delivery adds another layer. It’s right in the consumer’s pocket, available at any time. Pablo emphasized that it has enormous potential, although its future growth will depend on the model’s profitability and reliability.
For the Food Service sector, understanding this structural convergence with food retail will be essential to competing for new consumption opportunities.
On Food Radar, you can access the full webinar and the 2025 Food Service Results Report for free, as well as a wealth of additional information about the food service industry.
Information is power!